Showing posts with label Database Management System. Show all posts

Monday, December 2, 2019

Connecting Visual Studio 2008 to MySQL Database using ODBC Connector

Step 1: Install MySQL Database like MySQL Server 5.0
Step 2: Install ODBC Connector like Connector ODBC 5.1
Step 3: Create a project in Visual Studio

Project Type: Visual Basic -> Windows
Project Template: Windows Forms Application


Step 4: Click My Project on your Solution Explorer
Step 5: Click on Reference Tab


Step 6: Click on Add 
Step 7: Click on COM Tab
Step 8: Look for Microsoft ActiveX Data Object 2.7 Library or higher version
Step 9: Click OK

Step 10: On your Project Explorer right click on your project name and mouse over Add
Step 11: Add Module

Step 12: Add the following code on the very top of other code

Imports ADODB

Step 13: Add the following code just below the Module Module 1

Public conn As New ADODB.Connection
Public rs As New Recordset
Public lvi As ListViewItem

Step 14: Add the following code just below Public lvi As ListViewItem

Public Sub Connection()
        On Error GoTo Err
        If conn.State = ObjectStateEnum.adStateOpen Then conn.Close()
            conn.ConnectionString = "Driver=MySQL ODBC 5.1 Driver;Server=Localhost;Port=3306;Database=name_of_my_database;UID=mysqluser;PWD=mysqlpassword;Option=3;"
           conn.ConnectionTimeout = 5
           conn.CursorLocation = CursorLocationEnum.adUseClient
           conn.Open()
           Exit Sub
Err:
        MsgBox(Err.Description, MsgBoxStyle.Information + MsgBoxStyle.Critical)
    End Sub

Note: Driver may depend on the driver you have installed. Server may vary if the mysql database is installed on your machine or to the other computer, if it is the second then use the other computer's IP Address instead of Localhost but be sure you have enabled Allow Remote Connection during the installation of your MySQL Database. Port may also vary if what port number you have used during the installation of MySQL Database, Database name may vary on the created database in your MySQL Database Server, as well as the UID which uses "root" as the default user when you install MySQL and the PWD or password you set up during the MySQL installation while Option = 3 should be kept as is. Lastly there is no restriction on the number of ConnectionTimeout so you decide. THIS IS YOUR CONNECTION SCRIPT TO CONNECT VB.net to MySQL

Step 15: Add the following code after the End Sub of Public Sub Connection()

Public Sub OpenRecord(ByVal sql As String)
        On Error GoTo Err
        If rs.State = ObjectStateEnum.adStateOpen Then rs.Close()
        rs.Open(sql, conn, CursorTypeEnum.adOpenDynamic, LockTypeEnum.adLockOptimistic)
        Exit Sub
Err:
        MsgBox(Err.Description, MsgBoxStyle.Information)
    End Sub

Note: sql comes from your parameter while conn comes from the variable declaration on top.

Step 16: Go back to your design and double click on your form and add this code just below the Public Class Form1

Dim isEdit As Boolean = False

Step 17: On your Form_Load() add the following lines

Connection() 'this will call the connection script
getAllUsers("") 'this will retrieve all previous data from users table.

Note: Be sure you have created a database in your MySQL and should have at least one table like "users" with fields userid int type, username and password text type

Step 17: Double click on your CLEAR button and add this lines inside

TextBox1.Clear()
TextBox2.Clear()
TextBox3.Clear()
getAllUsers("")

Step 18: Go back to your design and double click on your SAVE Button and add this lines

 If Trim(TextBox1.Text) <> "" Or Trim(TextBox2.Text) <> "" Or Trim(TextBox3.Text) <> "" Then
            OpenRecord("Select * from user Where userid = '" & TextBox1.Text & "'")
            With rs
                If isEdit = False Then 'add new record
                    .AddNew()
                    .Fields("userid").Value = TextBox1.Text
                    .Fields("username").Value = TextBox2.Text
                    .Fields("password").Value = TextBox3.Text
                    .Update()
                    MsgBox("New user added.", MsgBoxStyle.Information)
                Else 'edit existing record
                    .Fields("username").Value = TextBox2.Text
                    .Fields("password").Value = TextBox3.Text
                    .Update()
                    MsgBox("Information has been edited.", MsgBoxStyle.Information)
                    TextBox1.Enabled = True
                End If
            End With
        Else
            MsgBox("Incomplete Fields. Please try again.", MsgBoxStyle.Information)
        End If
        Button2_Click(sender, e)
        getAllUsers("")

Step 19: Go back to your design and double click on button EDIT and add this lines

If ListView1.Items.Count = 0 Then Exit Sub
If ListView1.SelectedItems.Count = 0 Then Exit Sub

TextBox1.Text = ListView1.SelectedItems.Item(0).SubItems(0).Text
TextBox2.Text = ListView1.SelectedItems.Item(0).SubItems(1).Text
TextBox3.Text = ListView1.SelectedItems.Item(0).SubItems(2).Text
TextBox1.Enabled = False
 isEdit = True


Step 20: Go back to your design and double click on DELETE button and add this lines

If ListView1.Items.Count = 0 Then Exit Sub
If ListView1.SelectedItems.Count = 0 Then Exit Sub

If MsgBox("This action will delete the selected user. Do want to continue?", MsgBoxStyle.YesNo) = MsgBoxResult.Yes Then

      OpenRecord("Delete from user where userid = '" &   ListView1.SelectedItems.Item(0).SubItems(0).Text & "'")
      getAllUsers("")
      MsgBox("Selected user has been deleted.", MsgBoxStyle.Information)
End If

Step 21: Go back to your design and double click on Textbox for searching and add this lines

Private Sub TextBox4_TextChanged(ByVal sender As System.Object, ByVal e As System.EventArgs) Handles TextBox4.TextChanged
        getAllUsers(TextBox4.Text)
End Sub

Step 22: Add this code at the very end of the script but do not go beyond the "End Class" for your code may not run successfully.

Public Sub getAllUsers(ByVal str As String)
        ListView1.Items.Clear()

        OpenRecord("Select * from user Where username like '" & str & "%'")
        With rs
            While Not .EOF
                lvi = ListView1.Items.Add(.Fields("userid").Value)
                lvi.SubItems.Add(.Fields("username").Value)
                lvi.SubItems.Add(.Fields("password").Value)
                .MoveNext()
            End While
        End With
    End Sub


Wednesday, October 16, 2019

Lesson 4 : Function

A function in SQL looks very similar to procedure, only unlike procedure it needs to return a value as output. A function could be a sub-routine in a query or a procedure for computations and other task that needs to be automated inside the database management system.


With the table above we could generate a pay slip for each Employee with net amount 59,550.00 and 39,600.00 respectively as both employees has deductions for SSS and GSIS.

By means of creating a pay slip, we could do that by simply creating a sub-query like this:

SELECT e.*, t1.netamount FROM Employee AS e INNER JOIN (SELECT Amount-(SELECT SUM(Amount) FROM Deductions WHERE EmployeeID='16-M89031')AS netamount,EmployeeID FROM salary WHERE EmployeeID='16-M89031') AS t1 ON t1.EmployeeID = e.EmployeeID

And we can even integrate it into creating a payroll for the whole company but what if there is a requirement on your program which will only generate the NetAmount for a specific employee, it will only return the value 59,550.00 or 39,600.00

Then maybe you need to prepare a single function for that option.

Syntax

DELIMITER $$
CREATE FUNCTION NAME() RETURNS DOUBLE
BEGIN
END$$
DELIMITER;

Example

DELIMITER $$
CREATE FUNCTION getNetSalary() RETURNS DOUBLE
BEGIN
RETURN (SELECT Amount-(SELECT SUM(Amount) FROM Deductions WHERE EmployeeID='16-M89031')AS netamount FROM salary WHERE EmployeeID='16-M89031');
END$$
DELIMITER;


The example above could be called on your program using this command

Select getNetSalary();

But it is a custom query that will only return the net salary of employee 16-M89031. To make if more useful, reusable for other employee we will add a parameter on that function to make it dynamic, see example below:

Example

DELIMITER $$
CREATE FUNCTION getNetSalary(EID VARCHAR(20)) RETURNS DOUBLE
BEGIN
RETURN (SELECT Amount-(SELECT SUM(Amount) FROM Deductions WHERE
EmployeeID=EID)AS netamount FROM salary WHERE EmployeeID=EID);
END$$
DELIMITER;


Activity

With the example table above create a simple function which will return the total NETINCOME of each employee for the whole year.

Lesson 3 : Procedure

A procedure often called a stored procedure is a sub-routine like a sub-program in a regular programming language or computing language but is stored in the database. A procedure requires a name and two types of parameter, the IN and OUT parameter or at least one of the parameter. All most relational database supports stored procedure.

With the sample table above, it would be logical to fire a select query on table Employee first to get EmployeeID then fire another query back to the database inserting new information to Deductions table. 

Example in VB.net 

OpenRecord(“Select EmployeeID from Employee”) 
     with rs 
          while not .eof 
              OpenRecord1 (“Insert into Deductions values(default,’GSIS’, 200,’” & 
              .fields(0).value & ”’)”) 
        .movenext 
    end with

In the above sample code the program has used the port 3306 for 4 times just for two employees, now imagine if you have 1000 employees there would be 1002 queries to be fire,two for select and 1000 for insert. In this case it might cause a disconnection to another query. With stored procedure, we will only fire one query into the database calling the stored procedure with the required parameter and let the procedure execute the command within the database itself. 

Syntax 

DELIMITER $$ 
CREATE PROCEDURE newDeductions(IN tt text, IN aa double, IN ) 
BEGIN 
Do something here… 
END$$ 
DELIMITER ; 

Example 

DELIMITER $$ 
CREATE PROCEDURE newDeductions(IN tt text, IN aa double) 
BEGIN 
DECLARE FINISHED INTEGER DEFAULT 0; 
DECLARE EID VARCHAR(100) DEFAULT ””; 
DECLARE EID_CURSOR CURSOR FOR SELECT EmployeeID FROM Employee; 
DECLARE CONTINUE HANDLER FOR NOT FOUND SET FINISHED = 1; 
OPEN EID_CURSOR; 
getIDandSAVEDeductions: LOOP 
FETCH EID_CURSOR INTO EID; 
IF FINISHED = 1 THEN 
LEAVE getIDandSAVEDeductions; 
END IF 
INSERT INTO Deductions VALUES(DEFAULT, tt, aa, EID); 
END LOOP getIDandSAVEDeductions; 
CLOSED EID_CURSOR; 
END$$ 
DELIMITER ;

Then call your stored procedure in your program like this 

OpenRecord(“CALL newDeductions(‘GSIS’,200)”); 

The call statement will initiate the Store Procedure to execute the sub-routine commands or instructions with only one fired query into the database saving the traffic of your port 3306.


Activity 

In your mysql database, create a table for top candidates of a pageant. This will contain the following fields {CandidateNo, CandidateName, CandidatePosition, CandidateScore}. Candidates’ Position will be numbered as 1,2,3,4,5 and so on. Whenever a database user deletes candidates from the table especially in the middle position like 2 or 3 the lower position will be change to a higher position. See Example…


Lesson 2 : Trigger

A trigger is a feature in most databases which serves as a background function that will execute on table’s changes. This execution will create changes to other table like update, delete or add a new row of information. Instead of having to navigate to other table to manually change its information or having to fire another set of query after the first one, trigger will automatically do the task for the database administrator or the programmer in the background without having to fire another query from the client program or manually navigate into the other table to do changes. For example when I add a new employee in EMPLOYEE table it will add a new count on POPULATION table according to gender.


Syntax 

DELIMITER $$ 
CREATE 
TRIGGER UpdatePopulation 
BEFORE/AFTER INSERT/UPDATE/DELETE ON `scheduling`.`<Table Name>` 
FOR EACH ROW 
BEGIN 
“DO SOMETHING HERE” 
END$$ 
DELIMITER ; 

Example 

DELIMITER $$ 
CREATE 
TRIGGER UpdatePopulation AFTER INSERT ON Employee FOR EACH ROW 
BEGIN 
Update Population set HeadCount = HeadCount+1 Where Gender = Gender.NEW; 
END$$ 
DELIMITER ; 

Note: BEFORE/AFTER INSERT/UPDATE/DELETE ON `scheduling`.`<Table Name>` 

This line indicates when the trigger will be executed, will it be BEFORE some changes are done to the first table or AFTER a change is done to the first table and will it be before an insert, update or delete happen on the first table or after an insert, update or delete happen on the first table. 

6 Combinations: 

BEFORE INSERT                        AFTER INSERT 

BEFORE UPDATE                      AFTER UPDATE 

BEFORE DELETE                       AFTER DELETE 

Activity: 

On your Elementary Grading System create a table Population and implement 3 triggers on it for AFTER INSERT, UPDATE and DELETE on the STUDENTS table. These triggers will update the total population of each classroom according to the students’ gender. 


Lesson 1 : Views

Just like a normal entity a view has its own attributes. It will look like a normal table but without a primary key itself and all data or information are borrowed from one or more table from the same database. For example personal information from the EMPLOYEE table is combined with the information in SALARY table to create a new set of information ready for retrieval. The good side of having views in your database is that you can distribute an information to any other system or people without having given them the actual editable table, meaning, whatever the changes on the view will not affect the original table.


Syntax

CREATE VIEW MonthlySalary AS (SELECT * FROM ...);

Sample

Create view MonthlySalary as Select e.Fullname as Employee, e.Position as Position, s.Amount * 20 as Salary from Employee as e inner join salary as s on e.SalaryGrade = s.SalaryGrade

Activity

Create a database for elementary grading system which will house views that gives this information:

1. List of students per subject with their average grades arrange in a descending order by average.

2. List of students per classroom with the average grade for all subjects {English, Math, Filipino, Science, PE, MAPEH, Araling Panlipunan and GMRC } arrange in a descending order by average.

Lesson 5: Database Normalization

Normalization
  • Involves four stages: un-normalized design, first normal form, second normal form, and third normal form
  • Most business-related databases must be designed in third normal form
  • A technique used to make complex databases more efficient and easier to handle
  • Eliminates Redundant Data
Normalization: Standard Notation Format
Designing tables is easier if you use a standard notation format to show a table’s structure, fields, and primary key

Example: NAME (FIELD 1, FIELD 2, FIELD 3)

Normalization: Repeating Groups and Un-normalized Design
  • Repeating group
  • Often occur in manual documents prepared by users
  • Un-normalized design
Example:


Normalization: First Normal Form

  • A table is in first normal form (1NF) if it does not contain a repeating group
  • To convert, you must expand the table’s primary key to include the primary key of the repeating group
Example:


Normalization: Second Normal Form
  • To understand second normal form (2NF), you must understand the concept of functional dependence
  • Field X is functionally dependent on field Y if the value of field X depends on the value of field Y
  • A standard process exists for converting a table from 1NF to 2NF

1. Create and name a separate table for each field in the existing primary key
2. Create a new table for each possible combination of the original primary key fields
3. Study the three tables and place each field with its appropriate primary key 
  • Four kinds of problems are found with 1NF description that do not exist with 2NF
4. Consider the work necessary to change a particular product’s description
5. 1NF tables can contain inconsistent data
6. Adding a new product is a problem
7. Deleting a product is a problem

Normalization: Third Normal Form
  • 3NF design avoids redundancy and data integrity problems that still can exist in 2NF designs
  • A table design is in third normal form (3NF) if it is in 2NF and if no non-key field is dependent on another non-key field
Example:
To convert the table to 3NF, you must remove all fields from the 2NF table that depend on another non-key field and place them in a new table that uses the non-key field as a primary key


Lesson 4: Entity Relationship Diagram


An entity-relationship diagram (ERD), also known as an entity-relationship model, is a graphical representation of an information system that depicts the relationships among people, objects, places, concepts or events within that system. An ERD is a data modeling technique that can help define business processes and be used as the foundation for a relational database (Rouse, Biscobing, & Aberle, 2018). 

Importance of ERDs and their uses 

Entity-relationship diagrams provide a visual starting point for database design that can also be used to help determine information system requirements throughout an organization. After a relational database is rolled out, an ERD can still serve as a referral point, should any debugging or business process re-engineering be needed later. 

However, while an ERD can be useful for organizing data that can be represented by a relational structure, it can't sufficiently represent semi-structured or unstructured data. It's also unlikely to be helpful on its own in integrating data into a pre-existing information system. 

Main components of an ERD 

ERDs are generally depicted in one or more of the following models: 

  1. A conceptual data model, which lacks specific detail but provides an overview of the scope of the project and how data sets relate to one another. 
  2. A logical data model, which is more detailed than a conceptual data model, illustrating specific attributes and relationships among data points. While a conceptual data model does not need to be designed before a logical data model, a physical data model is based on a logical data model. 
  3. A physical data model, which provides the blueprint for a physical manifestation -- such as a relational database -- of the logical data model. One or more physical data models can be developed based on a logical data model. 
There are three basic components of an entity-relationship diagram: 

1. Entities, which are objects or concepts that can have data stored about them. 

Example:


2. Attributes, which are properties or characteristics of entities. An ERD attribute can be denoted as a primary key, which identifies a unique attribute, or a foreign key, which can be assigned to multiple attributes.

Example:


3. The relationships between and among those entities. 

Example:


For example, an ERD representing the information system for a company's sales department might start with graphical representations of entities such as the sales representative, the customer, the customer's address, the customer's order, the product and the warehouse. (See diagram above.) Then lines or other symbols can be used to represent the relationship between entities, and text can be used to label the relationships. 

A cardinality notation can then define the attributes of the relationship between the entities. Cardinalities can denote that an entity is optional (for example, a sales rep could have no customers or could have many) or mandatory (for example, there must be at least one product listed in order.) 


While there are tools to help draw entity relationship diagrams, such as computer-aided software engineering (CASE) tools, some relational database management systems also have design capabilities built-in. 

Most Complete Cardinality based on Information Engineering (IE), Martin and Crow’s Foot has the following:


Data Structure 

— Database has two parts: 
  1. Data 
  2. Data Structure: how the data is organized. 
Data Model: 
representation of entities and their relationships to the real world 

Primary Key: 
  • a unique identifier in the database 
  • one or more fields 

Data Type 

each field in the database needs to be of a certain type 

Examples: text, number, dates 

Database Management Systems Approaches 

— Database Models 

— The Hierarchical Model 

— The Network Model 

— Relational Model 

— Normalization 

— Associations 

Database Models: Hierarchical Model 

In a hierarchical database, data is organized like a family tree or organization chart, with branches representing parent records and child records 

Example: 

Records in parent entities can have many child records, but each child can have only one parent. 


Database Models:

1. Network Model 

A network database resembles a hierarchical design but provides somewhat more flexibility 

Example: In this case you can have multiple children and parents


2. Relational Model 

The relational model was introduced during the 1970s and became popular because it was flexible and powerful. Because all the tables are linked, a user can request data that meets specific conditions. New entities and attributes can be added at any time without restructuring the entire database 

— A good relational database design eliminates unnecessary data duplications and is, therefore, easier to maintain 

— Relationship: joining two tables on a common field


Works Cited

1. Rouse, M., Biscobing, J., & Aberle, L. (2018, March 1). Entity Relationship Diagram (ERD). Retrieved from https://searchdatamanagement.techtarget.com: https://searchdatamanagement.techtarget.com/definition/entity-relationship-diagram-ERD

Tuesday, October 15, 2019

Lesson 3: Data Flow Diagram (DFD)


What is Data Flow Diagram?

A Data Flow Diagram is intended to serve as a communication tool among

1. systems analysts
2. end users
3. data base designers
4. system programmers
5. other members of the project team

A data flow diagram (DFD) is a graphical tool that allows system analysts (and system users) to depict the flow of data in an information system.

The DFD is one of the methods that system analysts use to collect information necessary to determine information system requirements.

Data flow diagram (DFD) is a picture of the movement of data between external entities and the processes and data stores within a system

Example


Source/Sink (External Entity)

External entity that is origin or destination of data (outside the system)
Is the singular form of a department, outside organization, other IS, or person
Labels should be noun phrases

Source – Entity that supplies data to the system
Sink – Entity that receives data from the system

DFD Symbols

Entity Symbol
  • Symbol is a rectangle, which may be shaded to make it look three-dimensional
  • An entity name is the singular form of a department, outside organization, other information system, or person
  • Name of the entity appears inside the symbol
  • A DFD shows only the external entities that provide data to the system or receive output from the system
  • can be duplicated, one or more times, on the diagram to avoid line crossing.
  • determine the system boundary. They are external to the system being studied. They are often beyond the area of influence of the developer.
  • go on margins/edges of data flow diagram
  • Entities also called
  1. Terminators: because they are data origins or final destination
  2. Source: for entity that supplies data to the system
  3. Sink: for entity that receives data from the system
Rules for Entity
  1. External people, systems and data stores
  2. Reside outside the system, but interact with system
  3. Either a) receive info from system, b) trigger system into motion, or c) provide new information to system
  4. e.g. Customers, managers
  5. Not clerks or other staff who simply move data
  6. Must be connected to a process by a data flow
  7. Entity can be connected with a process only
Data store symbol
  1. Represent data that the system stores
  2. A DFD does not show the detailed content of data store
  3. The physical characteristics of a data store are unimportant because you are concerned only with a logical model
  4. Is a flat rectangle that is open on the right side and closed on the left side
  5. A data store name is a plural name consisting of a noun and adjectives, if needed
  6. can be duplicated, one or more times, to avoid line crossing.
  7. is detailed in the data dictionary
  8. Rules for Data store
  9. Internal to the system
  10. Data at rest
  11. Include in system if the system processes transform the data
  • Store, Add, Delete, Update
  1. Very data store on DFD should correspond to an entity on an ERD
  2. Data stores can come in many forms:
  • Hanging file folders
  • Computer-based files
  • Notebooks

  1. Must have at least one incoming and one outgoing data flo
  2. Is used in a DFD to represent data that the system stores
  3. Labels should be noun phrases
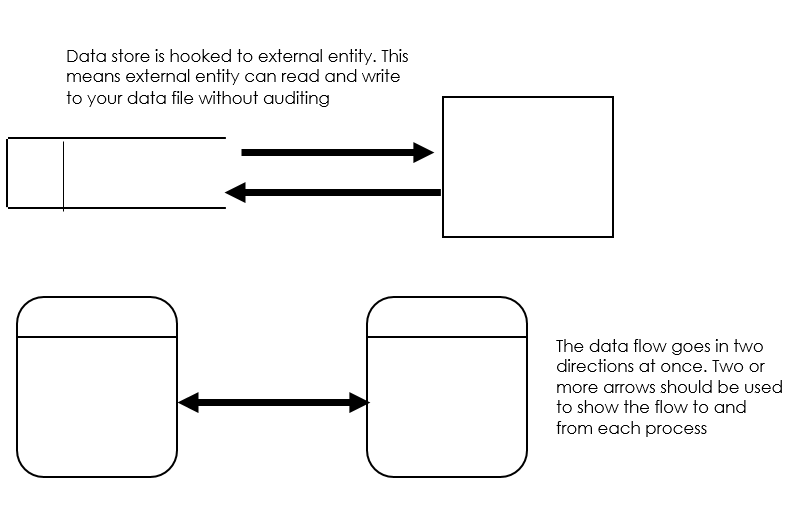
  4. A data store must be connected to process with a data flow
  5. A data store must have at least one incoming and one outgoing data flow
  6. One exception when data store has no input data flow because it contains fixed reference data that is not updated by the system
Data Flow Symbol

A data flow is a path for data to move from one part of the information system to anther
  1. Represents one or more data items
  2. The detailed content of the data flow does not appear in the DFD
  3. The symbol for a data flow is a line with a single or double arrowhead
  4. A data flow name consists of a singular noun and an adjective, if needed
  5. Is detailed in the data dictionary
  6. Is a path for data to move from one part of the IS to another
  7. Arrows depicting movement of data
  8. Can represent flow between process and data store by two separate arrows

Rules for Data Flow

Data in motion, moving from one place to another in the system
  • From external entity (source) to system
  • From system to external entity (sink)
  • From internal symbol to internal symbol, but always either start or end at a process
  • A join means that exactly the same data comes from any two or more different processes, data stores or sources/sinks to a common location
  • A data flow cannot go directly back to the same process it leaves
  • A data flow to a data store means update
  • A data flow from a data store means retrieve or use
  • A data flow has a noun phrase label
At least one data flow must enter and one data flow must exit each process symbol

Process Symbol
  1. Work or actions performed on data (inside the system)
  2. Labels should be verb phrases
  3. Receives input data and produces output
  4. Receives input data and produces output that has a different content, form, or both
  5. Contain the business logic which determines how a system handles data and produces useful information. Business logic, also called business rules, reflect the operational requirements of the business.
  6. Process name identifies a specific function and consists of verb, and an adjective, if necessary
  7. a process symbol can be referred to as a black box, because the inputs, outputs, and general functions of the process are known, but the underlying details and logic of the process are hidden 
Rules for Process
  1. Always internal to system
  2. Law of conservation of data:
  • Data stays at rest unless moved by a process.
  • Processes cannot consume or create data
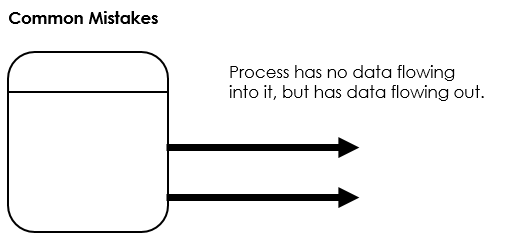
  1. Must have at least 1 input data flow (to avoid miracles)
  2. Must have at least 1 output data flow (to avoid black holes)
  3. Should have sufficient inputs to create outputs (to avoid gray holes)
  • Can have more than one outgoing data flow or more than one incoming data flow
  • Can connect to any other symbol (including another process symbol)
  • Logical process models omit any processes that do nothing more than move or route data, thus leaving the data unchanged. Valid processes include those that:
  1. Perform computations (e.g., calculate grade point average)
  2. Make decisions (determine availability of ordered products)
  3. Sort, filter or otherwise summarize data (identify overdue invoices)
  4. Organize data into useful information (e.g., generate a report or answer a question)
  5. Trigger other processes (e.g., turn on the furnace or instruct a robot)
  6. Use stored data (create, read, update or delete a record)
Types of Data Flow Diagram

Context Diagram 

A data flow diagram (DFD) of the scope of an organizational system that shows the system boundaries, external entities that interact with the system and the major information flows between the entities and the system 


Level-O Diagram 

A data flow diagram (DFD) that represents a system’s major processes, data flows and data stores at a high level of detail


Creating Data Flow Diagrams

Creating DFDs is a highly iterative process of gradual refinement.

General steps:

1. Create a preliminary Context Diagram
2. Identify Use Cases, i.e. the ways in which users most commonly use the system
3. Create DFD fragments for each use case
4. Create a Level 0 diagram from fragments
5. Decompose to Level 1,2,…
6. Go to step 1 and revise as necessary
7. Validate DFDs with users.

DFD Rules—General
  1. Basic rules that apply to all DFDs
  2. Inputs to a process are always different than outputs
  3. Objects always have a unique name
  4. In order to keep the diagram uncluttered, you can repeat data stores and sources/sinks on a diagram

DFD Rules—Context Diagram
  1. One process, numbered 0.
  2. Sources and sinks (external entities) as squares
  3. Main data flows depicted
  4. No internal data stores are shown
  • They are inside the system
  • External data stores are shown as external entities
  • How do you tell the difference between an internal and external data store?

Top-level view of IS
Shows the system boundaries, external entities that interact with the system, and major information flows between entities and the system.

Example: Order system that a company uses to enter orders and apply payments against a customer’s balance


DFD Rules – Level 0
  1. Shows the system’s major processes, data flows, and data stores at a high level of abstraction
  2. When the Context Diagram is expanded into DFD level-0, all the connections that flow into and out of process 0 needs to be retained.

Lower Level Diagrams 

  1. Functional Decomposition 
  • An iterative process of breaking a system description down into finer and finer detail
  • Uses a series of increasingly detailed DFDs to describe an IS 
  • When decomposing a DFD, you must conserve inputs to and outputs from a process at the next level of decomposition. This is called balancing.
Functional decomposition 
  1. Act of going from one single system to many component processes 
  2. This is a repetitive procedure allowing us to provide more and more detail as necessary 
  3. The lowest level is called a primitive DFD 
Level-N DiagramsLevel-N Diagrams
A DFD that is the result of n nested decompositions of a series of subprocesses from a process on a level-0 diagram

DFD Rules—Balancing DFDs 
  1. Balancing
  • The conservation of inputs and outputs to a data flow process when that process is decomposed to a lower level
  • Ensures that the input and output data flows of the parent DFD are maintained on the child DFD
A Balance Example 
  • We have the same inputs and outputs 
  • No new inputs or outputs have been introduced 
  • We can say that the context diagram and level-0 DFD are balanced 
An unbalance Example 
  • In context diagram, we have one input to the system, A and one output, B 
  • Level-0 diagram has one additional data flow, C 
  • These DFDs are not balanced


We can split a data flow into separate data flows on a lower level diagram. Balancing leads to four additional advanced rules

Example Level 0


Example Level 1


Strategies for Developing DFDs 

  1. Top-down strategy 
  • Create the high-level diagrams (Context Diagram), then low-level diagrams (Level-0 diagram), and so on.
  1. Bottom-up strategy
  • Create the low-level diagrams, then higher-level diagrams 
Summary
  1. During data and process modeling, a systems analyst develops graphical models to show how the system transforms data into useful information 
  2. Data flow diagrams (DFDs) graphically show the movement and transformation of data in the information system
  3. DFDs use four symbols: the process symbol transforms data; the data flow symbol shows data movement; the data store symbol shows data at rest; and the external entity symbol represents someone or something connected to the information system 
  4. Various rules and techniques are used to name, number, arrange, and annotate the set of DFDs to make them consistent and understandable


Works Cited
  1. Rosenblatt, H. J. (2013). Systems Analysis and Design. Boston, MA 02210, USA: Cengage Learning.
  2. SERAI, P. S. (2017, April 1). Chapter summary data flow diagrams dfds graphically. Retrieved from https://www.coursehero.com: https://www.coursehero.com/file/p5tdf33/Chapter-Summary-Data-flow-diagrams-DFDs-graphically-show-the-movement-and/
  3. Shelly, G., & Rosenblatt, H. J. (2009). Systems Analysis and Design. Boston, MA 02210, USA: Cengage Learning.


Lesson 2: Data and its types

Bit = The smallest unit in computing
Data = A fragments of information, are facts. In the electronic database, it is a composition of series of bits or bytes.

Note: Data is plural and Datum is singular

Information = a knowledge, or a group of data with specific meaning.

Database = storage of information or a pool of information.

Data types = in computing a data types represents the nature of the value in use. Is it a number or a word, a result in condition or an electronic object like photos or a document? Those terms as values needs a specific data types in order for the computing device to understand how the value will be treated in each operations from the set of instructions supplied by the user.

Example of common values and their data types:

Value
Term
Data type
100
Number
Int/Integer/Long
12.4
Number/Fraction
Double/Float
Rosito
Word/Name
String/Text/Varchar
True or False/1 or  0
Word
Boolean
!@#$%^
Symbols
Char/Varchar
񧒌󂻠򬄊𑃵
Symbols
Bit/Blob

====================================================================

Activity

I – Identify each values and write the corresponding data types.

1. 1
2. -1
3. 2.5
4. 0.9
5. Hello World!
6. Ñ
7. ,
8. 膾
9. ()
10. The quick brown fox jumps over the lazy dog.

II – Write the correct answer for each term or figure.

1. 10110111
2. 101FFA
3. False
4. Rosito Dutosme Orquesta
5. First name
6. Rosito
7. Boolean
8. Int
9. 8bits = ?
10. MySQL

Download PDF File

A REVIEW ON CONNIE DABATE’S MURDER CASE: Fitbit One Wearable

T he Author   ROSITO D. ORQUESTA MSIT Student at Jose Rizal Memorial State University-Dapitan Campus OIC-ICT Dean, Eastern Mindanao College ...